|
|
||||||||||||||||||||||||||||||||||||||||||||||||||||||||||||||||||||||||||||||||||||||||||||||||||||||||||||||||||||||||||||||||||||||||||||||||||
|
||||||||||||||||||||||||||||||||||||||||||||||||||||||||||||||||||||||||||||||||||||||||||||||||||||||||||||||||||||||||||||||||||||||||||||||||||

How Satellite Photo works? |
Satellite Photo - How does it work?
|
|||||||||||||||||||||||||
Satellite
Photo
|
|||||||||||||||||||||||||
Satellite Photo - Basic Concept |
|---|
 |
 |
Color enhanced imagery is a method meteorologists use to aid them
with satellite interpretation. The colors enable a meteorologist to
easily and quickly see features which are of special interest to
them. Usually they look for high clouds or areas with a large amount
of water vapor.
In an infrared (IR) image cold clouds are high clouds, so the colors
typically highlight the colder regions. In a water vapor image,
white areas indicate moisture and dark areas indicate little or no
moisture, so the colors typically highlight areas with large amounts
of moisture.
|
|
||||||||||||


About the Satellite Images
Infrared (IR) images | Visible
images | Water Vapour channel
Image Updates | Time Stamps
| Browsing the Archive
Infrared (IR) images
IR images are derived from radiation emitted from the Earth and its atmosphere at thermal-infrared wavelengths (10-12 µm). They provide information on the temperature of the underlying surface or cloud.
IR images are available 24 hours per day because temperatures can always be measured, regardless of day or night. (This is in contrast to Visible images which are only available during the day. See below.) The temperatures are represented either by a grey-scale (black is no-cloud, and increasing white means higher colder clouds), or in a colour scheme (900Kb).
IR imagery is available on: NOAA 15,
14, 12, 11 etc.: Channel 4: 10.3-11.3 µm Channel 5: 11.5-12.5 µm
GOES-9: Channel 4: 10.2-11.2 µm Channel 5: 11.5-12.5 µm GMS 5: IR1
10.3-11.3 IR2: 11.5-12.5 µm FY-2: IR1: 10.5-12.5 µm MTSAT: IR1:
10.3-11.3 IR2: 11.5-12.5 µm
Visible images
Visible (VIS) images are a record of the visible light scattered or reflected towards the satellite from the Earth and clouds. i.e. you can 'see' the clouds. Visible images give meteorologists extra information that may not appear on Infrared temperature images. For example, fog appears in Visible images, but may not in Infrared images when the fog and the land are at the same temperature.
Visible images are only available during the daytime, because at night the world looks black. VIS images are normally displayed in a manner similar to that seen by the human eye. Using a black and white colour scale, with different shades of grey indicating different levels of reflectivity, the brightest and most reflective surfaces are in white tones and the least reflective in black. In general, clouds are seen as white objects against the darker background of the earth's surface.
Visible imagery is available on:
- NOAA 15, 14, 12, 11 etc.: Channel 1: 0.58-0.68 µm Channel 2: 0.725-1.10 µm
- GOES-9: Channel 1: 0.55-0.75 µm
- GMS 5: VIS 0.55-0.8 µm
- FY-2: VIS 0.5-1.05 µm
- MTSAT: VIS 0.55-0.8 µm
Water Vapour channel
Water Vapour imagery is derived from radiation emitted by water vapour at wavelengths around 6-7 µm. This is not an atmospheric window but a part of the spectrum where water vapour is the dominant absorbing gas. The centre of the absorbing band is 6.7µm.
The water vapour channel is available on GOES-9, GMS, FY-2 and MTSAT.
More information on the Water Vapour channel (900Kb)Image Updates
The time stamp on the images is the start time of the reception of the top of the image from the satellite. It takes approximately 30 minutes for GOES-9 to complete a scan and the image is generally available on the Web within 30 minutes of completion, i.e an hour after the time stamp.
Time stamps
Satellite images are time stamped in "UTC" (Coordinated Universal Time), which is equivalent to GMT or Z time (Greenwich Mean Time). This is the start time of the reception of the top of the image from the satellite. It takes approximately 30 minutes for GOES-9 to complete a scan and the image is available on the Web within 30 minutes of completion, i.e an hour after the time stamp.
Below is a comparison of current UTC to current Eastern Standard Time (EST), Central Standard Time (CST) and Western Standard Time (WST) or the Daylight Saving equivalent.
To convert UTC times to local Australian times, add the time difference between your Australian time zone and UTC. For daylight saving add an extra hour to the difference between Australian times and UTC. During daylight saving, the difference for (EDT) i.e. New South Wales, Victoria and Tasmania is 11 hours instead of 10, and the difference for South Australia (CDT) is 10.5 hours instead of 9.5.
|
Browsing the Archive
A browse service provides free access to browse images for Visible (1:32 resolution) or Infrared (1:8 resolution) channels to assist with the selection of required dates and times for ordering higher resolution images or radiances from the Bureau's Satellite Data Archive.
|
Infrared images Thermal Infrared (IR) images show the temperature of the land, the sea or the tops of the clouds above them. Warm temperatures (0-30° C) generally mean land or sea without cloud cover. As the temperature decreases it implies that clouds are getting higher and denser. Very cold temperatures mean that cloud tops are very high, which can imply strong convective storm activity. IR imagery is derived from emission from the Earth and its atmosphere at thermal-infrared wavelengths (10-12 µm) and provides information on the temperature of the underlying surface or cloud. However, since the emitted radiation must traverse the Earth's atmosphere before reaching the satellite, it is modified during passage by atmospheric absorption and re-emission. The conventional displaying of IR images in black and white is to present them so they are consistant with the appearance of visible images by having the clouds appear in white shades against the darker background of the Earth. Since the temperature normally decreases with height, the IR radiation with the lowest intensity is emitted by the highest and coldest clouds and these appear whitest. This is convenient but is the reverse of the procedure used for VIS images where the lowest reflectivities appear black. Quantitative measurements of the temperature of an
emitting surface needs to take account of absorption and
emission within the window. However for qualitative
interpretation the atmosphere can normally be considered as
transparent in the window region. The only exception to this
is in the very warm, high dew point air in the tropics where
imagery of cloudless air may show patterns of grey shades
that are related to the humidity distribution. IR images are available 24 hours per day because temperatures can always be measured, regardless of day or night. (This is in contrast to Visible images which are only available during the day. See above.) The temperatures can be represented in a grey-scale (black is no-cloud, and increasing white means higher colder clouds), or in a colour scheme (dark-blue for land/sea and low cloud, through various colours for mid temperatures to very light shades for very cold high clouds). See below for the colour scheme we use. Colours In colour Infrared IR satellite images only, artificial colours have been added to indicate different temperatures. Temperatures at the base of each colour band are:
|
oooooooooooooooo
- Will DIRECWAY VoIP work with my existing DW6000 or DW4020 system?
- Can I sign up to the service and use a PC client instead of an analogue phone and the DW6040 to connect to my DW6000/DW4020?
- Is a specific grade of service plan needed for DIRECWAY VoIP?
- Is there a minimum contract term?
- Can I have more than one telephone number?

IP Videophone
Satellite Photo FAQ - Answers: |
Will DIRECWAY VoIP work with my existing DW6000 or DW4020 system?
DIRECWAY VoIP comprises a voice appliance known as
the DW6040. The DW6040 is designed and optimized to work with the DW6000 and
the DW4020 Internet access terminals. If you have any other DIRECWAY system, speak to your
dealer about upgrade options.
back to top
Can I sign up to the service and use a PC client instead of an analogue phone and the DW6040 to connect to my DW6000/DW4020?
No, the service is designed and optimized to work
with the DW6040 and provides constant bit rate support to ensure voice traffic is prioritized
over other data traffic. PC client software is not available and is not currently supported.
back to top
Is a specific grade of service plan needed for DIRECWAY VoIP?
All existing service plans from HNSE will support
voice over IP.
back to top
| Table of Contents |
| We all have our favorite radio stations that we preset into our car radios, flipping between them as we drive to and from work, on errands and around town. But when you travel too far away from the source station, the signal breaks up and fades into static. Most radio signals can only travel about 30 or 40 miles from their source. On long trips that find you passing through different cities, you might have to change radio stations every hour or so as the signals fade in and out. And it's not much fun scanning through static trying to find something -- anything -- to listen to. |
 Photo courtesy XM Satellite Radio Satellite radio broadcasters promise crystal-clear music transmitted from thousands of miles into space. |
For more information on satellite radio and related topics, check out the links on the next page.
TerraServer contains 3.3 tera-bytes of high resolution USGS aerial imagery and USGS topographic maps. You can locate imagery by clicking on the map above, entering a city or town name in the "Search TerraServer" form at the top of the page, or entering a U.S. street address. Click on Advanced Find to see other methods for searching our imagery database.
Below are sample thumb-nail images of famous places contained in the TerraServer database. Click on a thumb-nail image to see a famous place or click on more famous places to see a complete the complete list images of famous sites.
| Get a birds eye view of your home,
yard or street. We get you the finest High Resolution
Color Satellite and Aerial Photos for many different
uses. Satellite or Aerial photographs are available for
landowners, homeowners, travelers, vacationers, and for
professionals like architects, engineers, scientists,
geologists, appraisers, realtors and investigators. Most
photos are acquired within the last few months to a few years. You can get an aerial view of your own street, house and yard. You can view cars parked in someone's driveway and with infrared* photos you can even view people inside a house or cars parked in anyone's garage. You can get Satellite/Aerial Photo of your state, city, town or street. Photos are available for most locations in North America and specific locations in 56 other countries. High Resolution Satellite photos are available as digital files (3000 x 2400) or on paper in the following sizes: 8" x 10", 11" x 14", 16" x 20" and 20" x 30" as hardcopy prints. |
|
Satellite imagery also has many commercial uses including: * Land and water navigation * Pest control Zoning and land use planning * Fighting forest fires * Mapping *Investing in commodities * Tax assessment * Pollution control *Environmental monitoring * Habitat creation and protection * Oil and gold exploration * Organizing disaster relief * Building roads, bridges and dams * Earthquake preparation * Crop damage assessments * And much more. Satellite Surveillance is becoming an essential reference for civil engineers, farmers, city planners, insurance companies, environmentalists, geologists, freight carriers, investigative reporters -- and anyone concerned with the uses and abuses of satellite technology. |
|
| (Click here to view a Sample Color Satellite Photo) | |
| PHOTO SOURCES: | |
SPIN-2 SPIN-2 is a joint venture with the Russian space agency, SOVINFORMSPUTNIK. SPIN-2 imagery is film-based 2-meter panchromatic product that is digitized and ortho-rectified. SPIN-2 Offers 2-meter and 10-meter imagery and digital elevation models of areas throughout the world. ORBIMAGE |
|
 |
thumbnail to download DW6040 System User's Guide (PDF, 1,059K) |
 |
thumbnail to download DIRECWAY VoIP document (PDF, 1,820K) |
|
 |
thumbnail to download DW6040 System Configuration Data Sheet (PDF, 58K) |
|
Click
here if you need to download free Acrobat Reader® software |
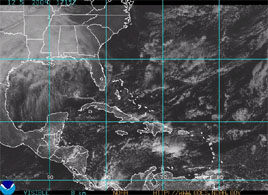
These images come from satellites which remain above a fixed point on the Earth (i.e. they are "geostationary"). The infrared image shows the invisible infrared radiation emitted directly by cloud tops and land or ocean surfaces. The warmer an object is, the more intensely it emits radiation, thus allowing us to determine its temperature. These intensities can be converted into greyscale tones, with cooler temperatures showing as lighter tones and warmer as darker.
Lighter areas of cloud show where the cloud tops are cooler and therefore where weather features like fronts and shower clouds are. The advantage of infrared images is that they can be recorded 24 hours a day. However, low cloud, having similar temperatures to the underlying surface, are less easily discernable. Coast-lines and lines of latitude and longitude have been added to the images and they have been altered to northern polar stereographic projection.
The infrared images are updated every six hours with the 0000, 0600, 1200 and 1800 UTC images. It usually takes about 20 minutes for these images to be processed and be updated on the website. The time shown on the image is in UTC.
| MapMart is a fantastic source all kinds of data, both for the US and worldwide. Make this your source for aerial and satellite imagery, scanned topographic maps, and vector street maps. | |

|
SDTS 10m and
30m DEM data for the United States
The USGS Geographic Data Download site is the central repository for USGS 1:250K DEMs (digital elevation model and satellite imagery), USGS 1:100K and 1:24K DLGs (Digital Line Graphic), and USGS LULC (land use and land cover) data. Of course, all of this data is ABSOLUTELY FREE for download. |
|
|
The Earth
Resources Observation Systems (EROS) Data Center (EDC) is a
data management, systems development, and research field
center for the U.S. Geological Survey's (USGS)
National Mapping
Division. Data searching and ordering may be performed
through a variety of information management systems and
interfaces, including:
|
|
|
The USGS Seamless Data Distribution Center provides access to several USGS data sets, including the following:
|

|
The Digital
Nautical Chart® is produced by the National Geospatial-Intelligence
Agency (NGA) and is an unclassified, vector-based, digital
database containing maritime significant features essential
for safe marine navigation.
The NGA Digital Nautical Charts site offers a large selection of marine charts in DNC format for free download. Initial data collection of the database is from a portfolio of approximately 5,000 nautical charts that will ultimately provide global marine navigation between 84° North latitude and 81° South latitude and support a variety of Geographic Information System applications. |

|
NOAA
National Environmental Satellite, Data and Information
Service - NESDIS operates the satellites and
manages the processing and distribution of millions of bits
of data and satellite images these satellites produce daily.
The prime customer for the satellite data is the NOAA
National Weather Service, which uses satellite data to
create forecasts for television, radio, and weather advisory
services. Click
here for the home page of NOAA
Satellites and Information (National Environmental
Satellite, Data and Information Service).
The NOAA Electronic Navigational Charts site offers a large selection of NOAA marine charts in S-57 format for free download. S-57 charts can be viewed in Global Mapper v6.00 and above. |
|
|
ASTER 30m
International DEM Data ASTER DEM data provided the first high-resolution alternative to DTED0. ASTER DEMs are available in HDF or Geotiff format. HDF is a self-describing format (like SDTS or shapefiles) that very few applications recognize. More can handle geotiff, but not the I16 or FP32 that ASTER DEMs are offered in. As a result, it takes more work than the casual user is willing to expend in order to use this data. Nevertheless, it is an extremely important data set and is expanding as more users request on-demand DEMs. See the article. This data is available at: The NGA Raster Roam site offers several NIMA data sets for free download, included VMAP levels 0 and 1, DTED level 0, ONC, and TPC data. |
| The MapAbility VMAP1 Downloads page provides a simpler alternative to the NGA Raster Roam site for obtaining VMAP level 1 data. Vector Map (VMap) Level 0 is an updated and improved version of the National Satellite Imagery and Mapping Agency's (NIMA) Digital Chart of the World (DCW®). The VMap Level 1 database provides worldwide coverage of vector-based geospatial data which can be viewed at 1:1,000,000 scale, i.e. 1cm=10km. It consists of geographic, attribute, and textual data stored on CD-ROM or as downloaded files. The primary source for the database is the 1:1,000,000 scale Operational Navigation Chart (ONC) series co-produced by the military mapping authorities of Australia, Canada, United Kingdom, and the United States. | |

|
The GIS Data Depot offers a wide variety of data, including 1:24K USGS DEM data for the US, 1:24K USGS DRGs (scanned topo maps), and a large selection of satellite imagery and vector data products. |

|
The updated National Atlas is designed to provide a reliable summary of national-scale geographical information. Though it cannot provide detailed map information, the Atlas directs users to other sources for this information. Most data is available in Shapefile, GeoTIFF, or SDTS vector format. |

|
GeoBase Canada provides a large assortment of FREE data for Canada, including Landsat-7 satellite imagery, 1:50K and 1:250 CDED elevation data, a National Road database in Shapefile format, and the Canadian Geographic Names data set in Shapefile format. |

|
This NASA site provides FREE LandSat satellite imagery for most of the Earth's land masses circa 1990. The GeoCover Landsat mosaics are delivered in a Universal Transverse Mercator (UTM) / World Geodetic System 1984 (WGS84) projection. The mosaics generally extend north-south over 5 degrees of latitude, and span east-west for the full width of the UTM zone. For mosaics between 60 degrees north and 60 degrees south latitude, the width of the mosaic is the standard UTM zone width of 6 degrees of longitude. For mosaics above 60 degrees of latitude, the UTM zone is widened to 12 degrees, centered on the standard UTM meridian. To insure overlap between adjacent UTM zones, each mosaic extends for at least 50 kilometers to the east and west, and 1 kilometer to the north and south. |
|
IR Sensors IR imagery is available on: |

| NOAA 15 Channel 4 10.3-11.3 µm |
NOAA 15 Channel 5 11.5-12.5 µm |
 |
|
| NOAA 14 Channel 4 10.3-11.3 µm |
NOAA Channel 5 11.5-12.5 µm |
 |
 |
Visible images
Visible (VIS) images are a record of the visible light scattered or reflected towards the satellite from the Earth and clouds. i.e. you can 'see' the clouds. Visible images give meteorologists extra information that may not appear on Infrared temperature images. For example, fog appears in Visible images, but may not in Infrared images when the fog and the land are at the same temperature.
The intensity of the image depends on the albedo/reflectivity of the underlying surface or cloud. Visible images are only available during the daytime, because at night the world looks black. Early morning 7am VIS images show the sunlight rising in the east, and the 7pm VIS images show the sun setting in the west.
VIS images are normally displayed in a manner similar to that seen by the human eye. Using a black and white colour scale, with different shades of grey indicating different levels of reflectivity, the brightest and most reflective surfaces are in white tones and the least reflective in black. In general, clouds are seen as white objects against the darker background of the earth's surface. The brightness also depends on the intensity of the reflectivity and the relative positions of the sun and satellite with respect to the earth. Shadows and highlights can be seen where the sun shines obliquely on to cloud. [Source Bader et al, 1995]
Visible imagery is available on:
- NOAA 15, 14, 12, 11 etc.: Channel 1: 0.58-0.68 µm Channel 2: 0.725-1.10 µm
- GOES-9: Channel 1: 0.55-0.75 µm
- GMS 5: VIS 0.55-0.8 µm
- FY-2: VIS 0.5-1.05 µm
- MTSAT: VIS 0.55-0.8 µm
GMS 5 VIS 0.55-0.8 µm

| NOAA 15: Channel 1 Visible 0.58-0.68 µm |
NOAA 14: Channel 1 Visible 0.58-0.68 |
Water Vapour channel
Water Vapour imagery is derived from radiation emitted by water vapour at wavelengths around 6-7 µm. This is not an atmospheric window but a part of the spectrum where water vapour is the dominant absorbing gas. The centre of the absorbing band is 6.7µm.
Emissions from water vapour low in the atmosphere will not normally escape to space. If the upper troposhpere is moist, the radiation reaching the satellite will mostly originate from this (cold) region and be displayed in white shades, following the IR imagery colour convention. Only if the upper atmosphere is dry will will radiation originate from water vapour at warmer, mid-troposheric levels and be displayed in darker shades on the image. In normally moist atmosphere , most of the WV radiation recieved by the satellite originates in the 300-600 hPa layer, but when the air is dry some radiation may come from layers as low as 800hPa. Because of the general poleward decrease of water vapour content, the height of the contributing layer gets lower towards the poles. [Source Bader et al, 1995]
The water vapour channel is available on GOES-9, GMS, FY-2 and MTSAT.

Image Updates
The time stamp on the images is the start time of the reception of the top of the image from the satellite. It takes approximately 30 minutes for GOES-9 to complete a scan and the image is generally available on the Web within 30 minutes of completion, i.e an hour after the time stamp. Sometimes an image is missed due to scheduled maintenance outages or a systems failure. The images remain available for 7 days.
Time Stamps
Satellite images are time stamped in "UTC" (Coordinated Universal Time), which is equivalent to GMT or Z time (Greenwich Mean Time). This is the start time of the reception of the top of the image from the satellite. It takes approximately 30 minutes for GOES-9 to complete a scan and the image is available on the Web within 30 minutes of completion, i.e an hour after the time stamp.
The colour enhanced imagery web pages also have the equivalent time in Eastern Standard Time (EST). One hour needs to be added during daylight saving.
Below is a comparison of current UTC to current Eastern Standard Time (EST), Central Standard Time (CST) and Western Standard Time (WST) or the Daylight Saving equivalent.
Visible images are only available during daylight hours, approximately EST 7am-7pm (21Z-09Z).
To convert UTC times to local Australian times, add the time difference between your Australian time zone and UTC. For daylight saving add an extra hour to the difference between Australian times and UTC. During daylight saving, the difference for (EDT) i.e. New South Wales, Victoria and Tasmania is 11 hours instead of 10, and the difference for South Australia (CDT) is 10.5 hours instead of 9.5.
|
Aerial photography and satellite photography work in similar fashion. Course and speed are set before entering the area to be photographed, to ensure uniformity of speed and altitude. The result is an image of a narrow strip, which can be combined with overlapping images of neighboring strips to produce a panoramic view, commonly called a mosaic. Commercially available aerial and satellite photographs are capable of resolving objects of about 10 sq ft (1 sq m), which means that a satellite would be able to distinguish between a car and truck. Aerial photographs may be high oblique (including the horizon), low oblique (below the horizon), or vertical (perpendicular to the earth). Only the vertical may be accurately scaled for mapmaking purposes. Often a multilens camera is used to photograph one section vertically and the adjacent areas obliquely. The individual oblique exposures are then corrected, scaled, and joined to the vertical section to form one continuous photograph. By viewing two overlapping photographs through a stereoscope, a three-dimensional image of a region, or topographic map, can be obtained.
Images can also be produced at other wavelengths, such as microwave or infrared, by using a technique known as remote scanning, which measures variations in spectral reflectance rather than patterns of light and shadow. Remote scanning aids such disparate fields as archaeology, geology, forestry, highway construction, and land conservation. The best-known remote scanners are the Landsat series of satellites, which have mapped vegetation and geological formations on the earth's surface since 1972; the French SPOT series, first launched in 1986; Magellan, which used radar to map the planet Venus (1990); Lunar Prospector, which mapped the moon's surface composition and its magnetic and gravity fields (1998); Mars Global Surveyor, which engaged in a systematic mapping of Mars (1999); and Galileo, which returned pictures of Jupiter and its major moons (1995–2003).
===============
http://southport.jpl.nasa.gov/desc/imagingradarv3.html
===============
http://www.ecotarium.org/exhibits/earthfromspace/game/qpages/4.html
=====
"All the Earth, all the time, live and in color": That's the pitch for a new infotainment company called AstroVision, based in Alexandria, Virginia, which has announced plans to place a webcam in geosynchronous orbit 22,000 miles above Earth. Unlike weather satellites, which usually provide one black-and-white image every 15 minutes, AstroVision (www.astrovis.com) will deliver a live, nearly continuous, true-color, super-hi-res feed of natural events such as volcanic eruptions, snowstorms, hurricanes, tornadoes, and large forest fires. Night promises to yield even more drama than day, with views of lightning borne on the tops of clouds and multikiloton-level air bursts from meteorites burning up in the stratosphere. "There is always something dramatic happening somewhere on the globe," says company founder and chief technical officer Malcolm LeCompte. "In space exploration, a pretty picture is far more than a pretty picture. It's loaded with information."
LeCompte started pitching his idea 10 years ago, leaving behind an academic career at Harvard studying the atmospheric chemistry of other planets. In July, he raised $5 million in first-round funding by convincing investors that the same people who consistently put the Weather Channel's Web site in Media Metrix's top 50 would also watch an Earthcam. The satellite itself is fairly simple, a suite of four high-definition CCD cameras - one wide-field and three targetable narrow-field units - coupled with a 320-Mbps, 8-GHz X-band downlink that will produce one frame every four seconds. Putting the satellite into orbit, however, will cost about $50 million, necessitating a second round of funding this fall.
If all goes as planned, the first bird will be aloft by the fall of 2002, and global coverage from a ring of five AVStar satellites will commence by mid-2004. LeCompte hopes the effort will not only be profitable but also increase the public's environmental awareness. "We'll be able to see what's going on in the rain forest, both the burning and the scars in full color," says LeCompte. "When people see the brown earth against the green of the forest canopy, 'slash-and-burn' will take on a whole new meaning."
=============
http://www-news.uchicago.edu/releases/03/030128.ancientroads.shtml
================
http://groups.msn.com/SpaceSatelliteSensing/aerialphotographyandsatelliteimagery.msnw